
The Art and Science of Technical Analysis in Trading: Unraveling Market Trends
Introduction:
In the realm of financial markets, traders are constantly in pursuit of methodologies that offer valuable insights to inform their trading decisions. Among the most revered and time-honored practices is technical analysis – a discipline that blends art and science to decipher market trends. In this article, we shall delve into the fascinating world of technical analysis, exploring its foundational principles, methodologies, and its significance in empowering modern traders to navigate the complex waters of trading.
Understanding Technical Analysis:
Like an alchemist seeking hidden truths, technical analysis is the study of historical market data, primarily price and volume, to forecast future price movements. It analyzes market patterns, trends, and chart formations to comprehend market dynamics and anticipate potential price trajectories. While fundamental analysis scrutinizes a company’s intrinsic value, technical analysis peers into the collective psyche of traders and market participants to discern patterns and trends.
The Key Principles of Technical Analysis:
- The Art of Price Movements: Technical analysis operates on the premise that market price movements are not haphazard but exhibit patterns, which reflect the interplay of supply and demand forces. These patterns recur across timeframes, providing a foundation for forecasting future price movements.
Example: The classic “Head and Shoulders” pattern, resembling its namesake, is a reliable bearish reversal formation often observed in stock charts.
Head and Shoulders pattern:

Source: www.elearnmarkets.com
- The Language of Charts: Technical analysis is intrinsically linked with chart reading. Various chart types, such as line charts, bar charts, and candlestick charts, present historical price data, with each providing unique visual cues for traders.
Example: Candlestick charts showcase distinct candlestick patterns like “doji,” “hammer,” or “engulfing,” which offer insights into market sentiment and potential trend reversals.
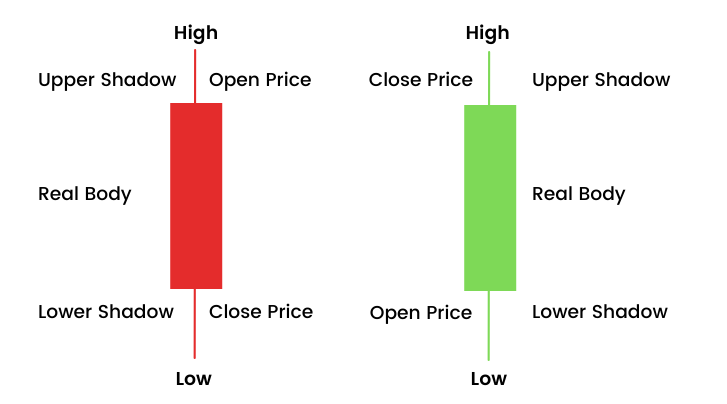
Source: www.elearnmarkets.com
- The Influence of Support and Resistance: Price levels where assets have historically found buying or selling pressure are known as support and resistance levels, respectively. These levels often act as pivotal points for market reversals.
Example: Consider a stock that consistently bounces off a support level at $50, indicating strong demand at that price level. Traders might strategically enter long positions near this level, anticipating a price rebound.

Source: www.investtech.com
- Indicators as Analytical Aids: Technical analysis employs an array of indicators and oscillators to augment price analysis. These tools gauge market momentum, overbought or oversold conditions, and trend strength.
Example: The Moving Average Convergence Divergence (MACD) indicator, which juxtaposes two moving averages, assists traders in identifying trend shifts and potential buy or sell signals.
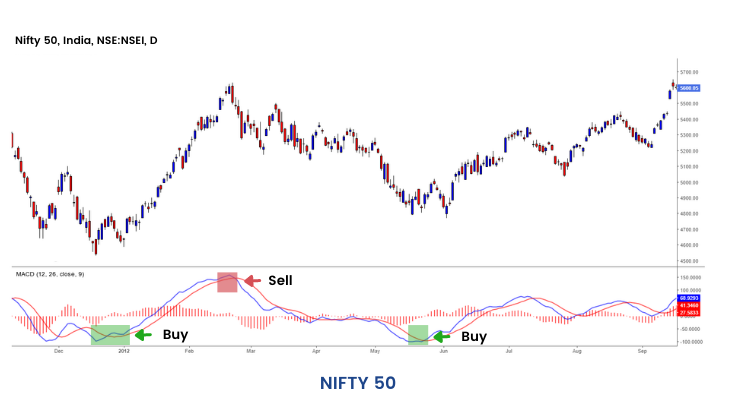
Source: www.elearnmarkets.com
Methodologies in Technical Analysis:
- Trend Identification: Identifying market trends is a fundamental aspect of technical analysis. Traders draw trendlines to visualize the direction of the prevailing trend, assisting them in making informed trading decisions.
Example: An upward-sloping trendline connecting successive higher lows in a stock’s price chart signifies an uptrend, presenting opportunities for long trades.
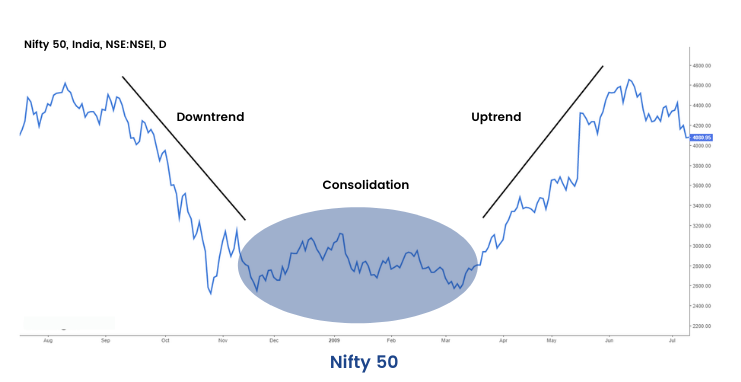
Source: www.elearnmarkets.com
- Pattern Recognition: Traders rely on chart patterns, such as triangles, flags, and double tops, to detect potential market reversals or continuation patterns.
Example: A “cup and handle” pattern, resembling a cup with a handle, is often interpreted as a bullish continuation pattern, indicating the potential resumption of an uptrend.
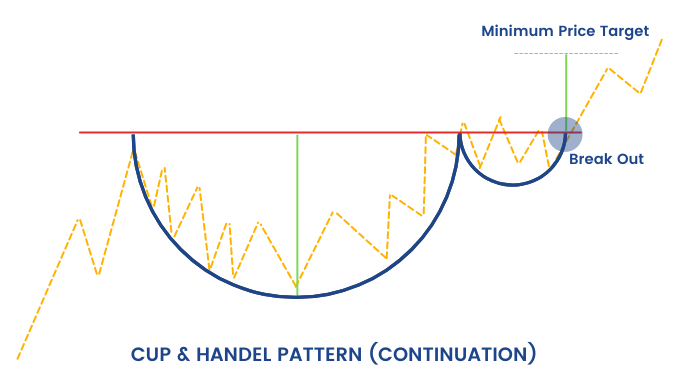
Source: www.elearnmarkets.com
- Moving Averages Analysis: Moving averages smooth out price data, revealing trend direction and potential support or resistance levels.
Example: The 200-day moving average is a widely followed indicator used in determining long-term trends. When a stock’s price remains above this average, it can be indicative of a bullish market sentiment.

Source: www.surgetrader.com
The Significance of Technical Analysis in Modern Trading:
- Timing of Entries and Exits: Technical analysis empowers traders to time their entry and exit points effectively, maximizing profit potential and mitigating risk.
Example: A trader might employ the crossover of a short-term moving average above a longer-term moving average as a trigger to enter a long position.
- Risk Management and Trade Planning: Technical analysis aids traders in setting stop-loss levels and establishing risk-to-reward ratios for each trade, promoting prudent risk management.
Example: By placing a stop-loss order below a significant support level, traders can limit potential losses if the market moves against their position.
- Market Sentiment and Psychology: By interpreting market patterns and indicators, traders gain insights into prevailing market sentiment, helping them make informed decisions based on crowd behavior.
Example: A sudden spike in the Relative Strength Index (RSI) above 70 might suggest an overbought condition, potentially foreshadowing an imminent price correction.
- Multiple Timeframe Analysis: Technical analysis accommodates traders with varying trading horizons, from short-term scalpers to long-term investors, by providing insights across multiple timeframes.
Example: A day trader may use intraday charts to time short-term trades, while a swing trader might reference daily or weekly charts for medium-term setups.
Conclusion:
Technical analysis stands as a versatile and potent analytical tool, guiding traders on a journey to unravel market trends and make well-informed trading decisions. From pattern recognition and trend identification to employing various indicators, the methodologies of technical analysis offer traders valuable insights and an edge in the dynamic world of financial markets. While not a crystal ball of certainty, this practice enriches trading strategies, aligns risk management, and enables traders to wield knowledge as their most potent weapon in pursuit of market success. So, dear traders, embrace the art and science of technical analysis, for within its intricacies lie the keys to unlocking profitable opportunities amidst the complexities of the trading landscape. May your trades be prosperous and your mastery of technical analysis be unparalleled!
By Frank J. Larsen