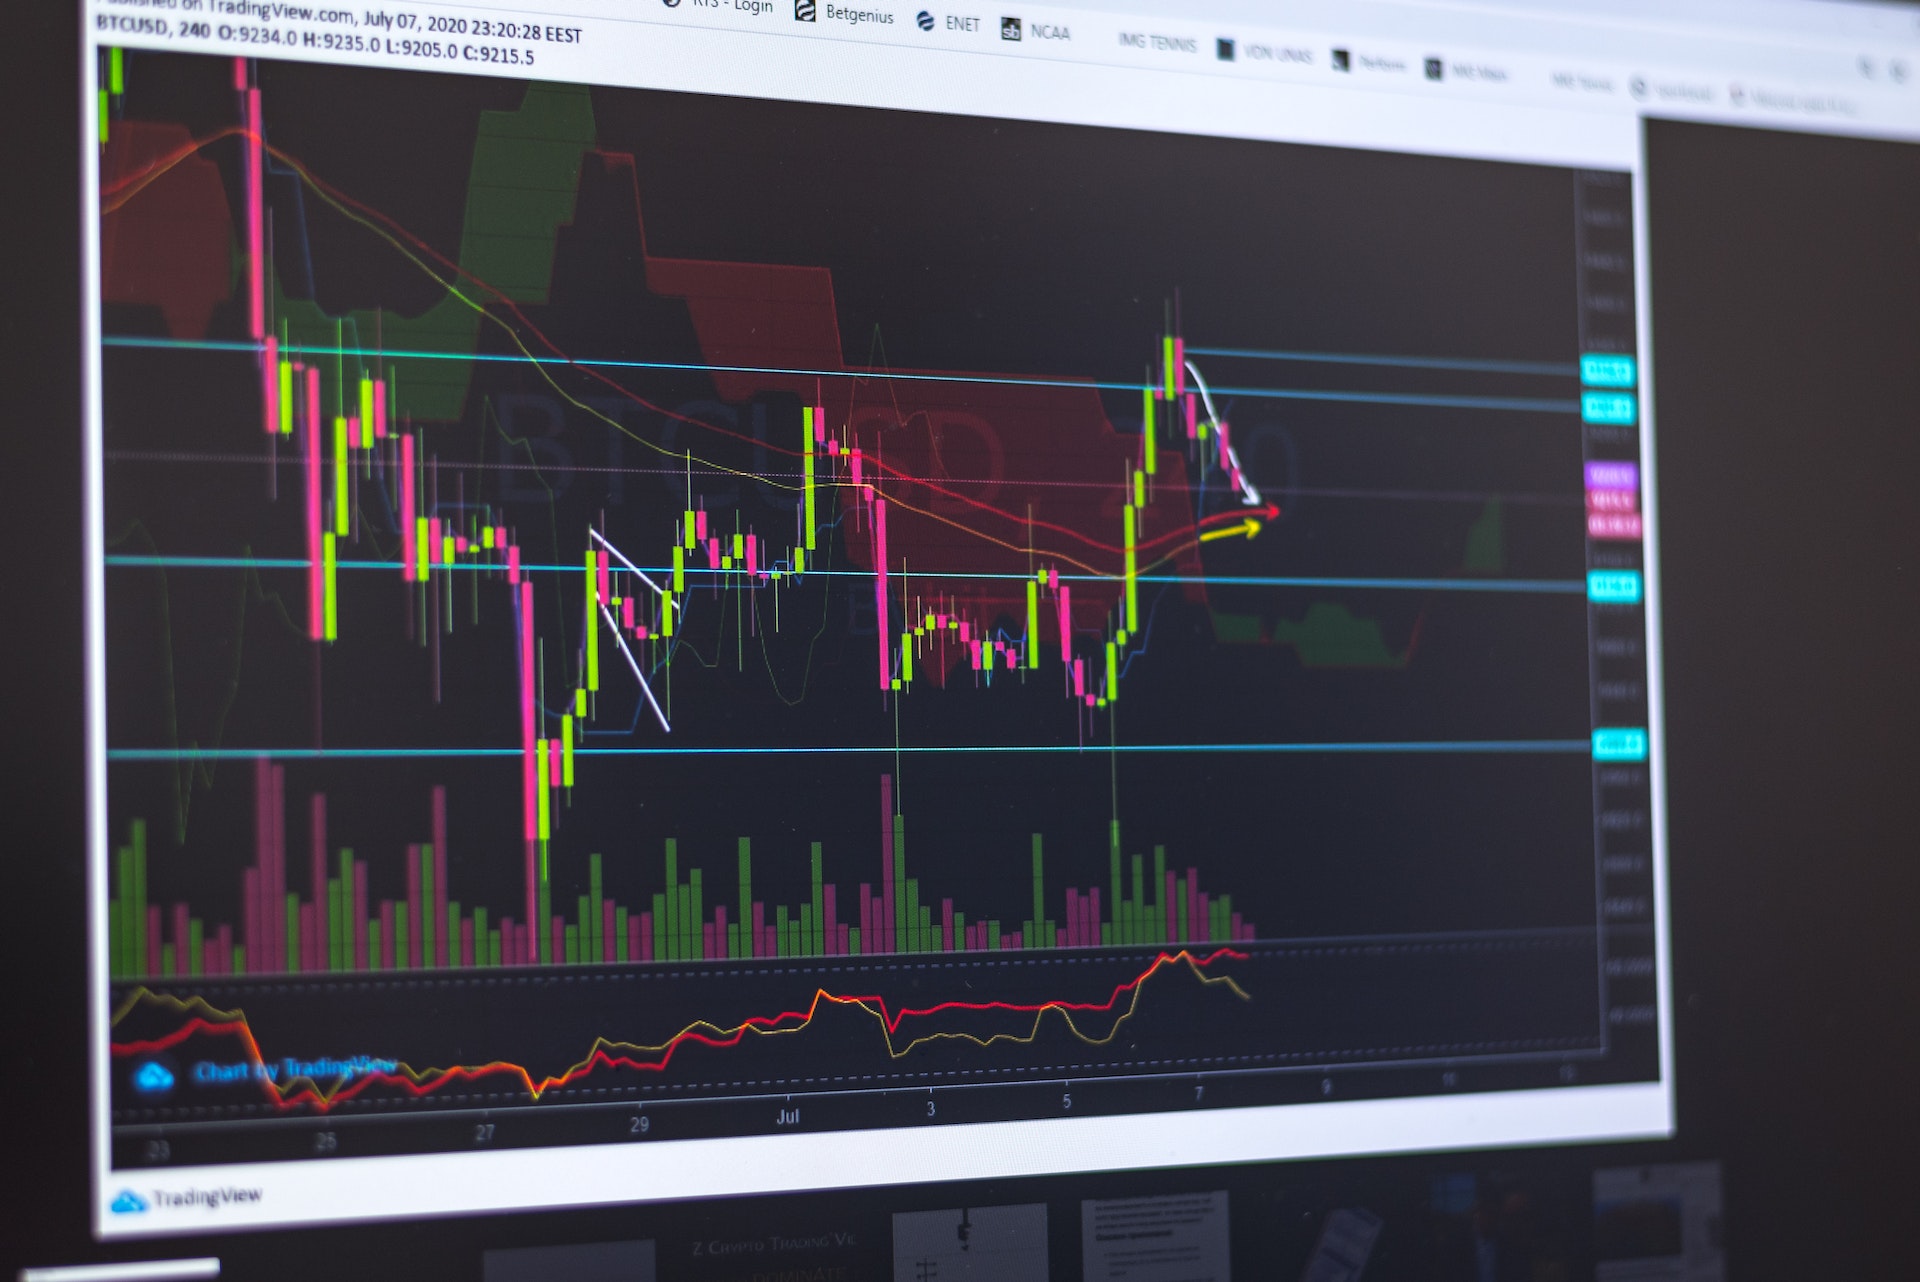
Support and Resistance
In technical analysis, support and resistance trading levels are the most discussed concepts traders used these terms to price on charts to determine three points of interest:
- Market direction
- timing the market entry
- establishing exit points in the market either at profit or loss
Understanding support and resistance levels:
Support is the price level of an asset that tends to stop falling and resistance is a price level that tends to stop rising. At the support level, the downtrend in the assets price is expected to pause due to demand or buying interest.
When the asset price or security falls, Demand for shares increases, Hence forming the support line. While the resistance level rises due to selling interest when prices have increased
you can use the prices level for entry or exit points once the support or resistance area is identified. As the price reaches a level of support or resistance, It will either bounce back away from the level of support/resistance or violate the prices and keep moving in its direction until it hits the next level of support or resistance.

Trading based on support and resistance.
The best trading strategy for using support and resistance is to buy near support area in uptrends or when chart patterns show prices moving up and to sell short near resistance area in downtrends or when chart patterns show prices moving down.
It helps in isolating the longer-term trends, also when trading a rage or chart, The trends guide in providing direction to trade-in.
for example, if there is a downtrend but a range develops. preferences should be given to short selling resistance instead of buying at range support.
In the uptrend, a triangle pattern is formed, prefer buying near the support zone of the triangle pattern.
Buying near support or selling near resistance can be beneficial but it has no guarantee that support or resistance will hold.
Therefore, the trader must wait for some confirmation that the market is still respecting that area.

